Why Subscribe?✅ Curated by Tommy Tang, a Director of Bioinformatics with 150K+ followers across LinkedIn, X, and YouTube✅ No fluff—just deep insights and working code examples✅ Trusted by grad students, postdocs, and biotech professionals✅ 100% free
The batch effect that flipped a landmark study
|
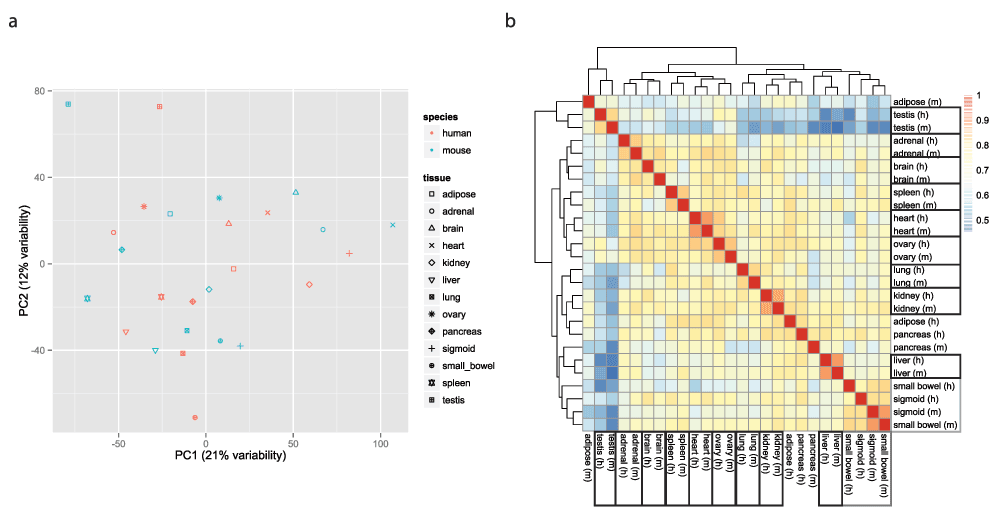
Hello Bioinformatics lovers, Tommy here. Today's newsletter is a little late :) In 2014, the Mouse ENCODE Consortium reported something that should not have been possible. They sequenced tissues from mice and humans, then compared the gene expression profiles. The samples clustered by species, not by tissue. A mouse liver looked more like a mouse skin than a human liver. That contradicted decades of comparative biology. A year later, Yoav Gilad and Orna Mizrahi-Man reanalyzed the same data. They traced the species clustering back to how the samples were sequenced. Human and mouse tissues had been run on different flowcells and lanes, and that technical assignment lined up almost perfectly with species. Once they corrected for it, the samples clustered by tissue exactly as expected. The surprising biology turned out to be a batch effect.
I think about that paper every time someone hands me a “ready to use” combined dataset. UCSC Xena is one of the best resources for this. Its combined TCGA, TARGET, and GTEx cohort runs tumor samples (TCGA), pediatric cancer samples (TARGET), and normal tissue (GTEx) through the same processing pipeline, so gene counts are computed the same way across all three. That solves the biggest problem with mixing public data: you stop comparing apples processed one way to oranges processed another. It does not solve the second problem. TCGA, TARGET, and GTEx were collected by different consortia, on different sequencers, with different RNA extraction protocols, by different hands. A shared pipeline makes the gene counts comparable. It does not erase who ran the sequencer or which reagent lot they used. Whether that residual batch effect shows up in the combined cohort is worth checking directly, not assuming away. I ran into a smaller version of this a decade ago, comparing salmon, kallisto, and STAR-HTseq output on the same RNA-seq samples. Salmon and kallisto tracked each other closely. (there are still differences close to the x and y-axis)
STAR-HTseq quantification drifted further from both, even though it was not a controlled benchmark since my colleague and I used different reference annotations. Pipeline choice alone was enough to move the numbers.
Public data like Xena’s combined cohorts saves weeks of reprocessing work. What it will not do is tell you when consortium-level batch effects are hiding in your PCA plot. That part still takes someone who knows to look. Have you found a batch effect hiding in a “clean” combined cohort? I would like to hear the story. Reply and let me know. Happy Learning! Tommy aka crazyhottommy PS: If you want to learn Bioinformatics, there are four ways that I can help:
Stay awesome! |


Chatomics! — The Bioinformatics Newsletter
Why Subscribe?✅ Curated by Tommy Tang, a Director of Bioinformatics with 150K+ followers across LinkedIn, X, and YouTube✅ No fluff—just deep insights and working code examples✅ Trusted by grad students, postdocs, and biotech professionals✅ 100% free